Unique to cTRAIN is it’s use in research applications reported in peer-reviewed scientific (peer-reviewed) journals. Below are graphs that show knowledge changes. These show pre-test performance on multiple choice tests of generally 20 or more questions before the training and post-test performance on the same questions after the training (but with the answers in a different order). Also shown are changes in behavior of the trainees based on observations of their work practices before and after the training. In each case we have had a second observer make simultaneous observations and the inter-observer agreement on the observations has generally been 85% to 95%.
Knowledge Improvements from Pre- to Post-Training in Studies using cTRAIN
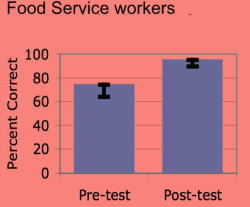
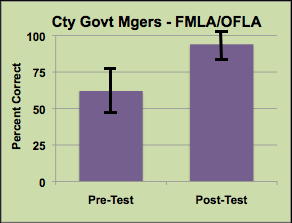
Shown below are knowledge changes from pre- to post-training in different studies. The trainees were current workers so they knew some of the information before the training. As a result, performance is well above chance at the pre-test. Tests for agricultural workers had 2 answers due to their limited education (many had to listen to the questions and answers read by cTRAIN). Test questions for the other groups had 4 answers.
Behavior or Work Practice Improvements from Pre- to Post-Training in Studies using cTRAIN
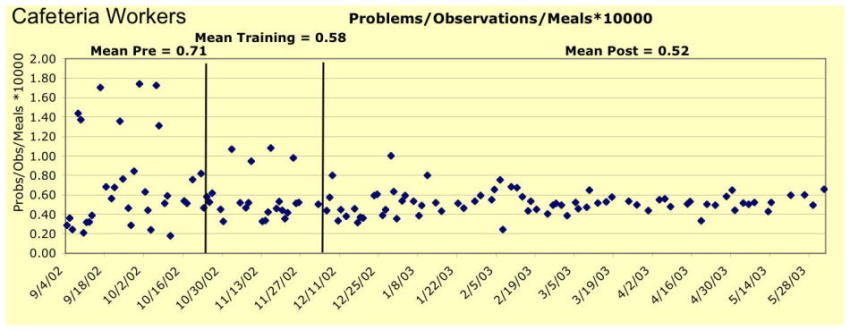
Shown below is published observational data from a study of cafeteria workers who were trained to use work practices that prevented slips and falls. Shown in the graph is the number of problem work practices (eg, leaving water on the floor) adjusted for the number of meals served as that number doubled over the course of the study. The main change was a reduction in the number of days with peak problem behaviors seen regularly during baseline.
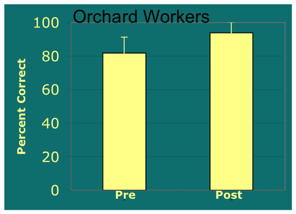
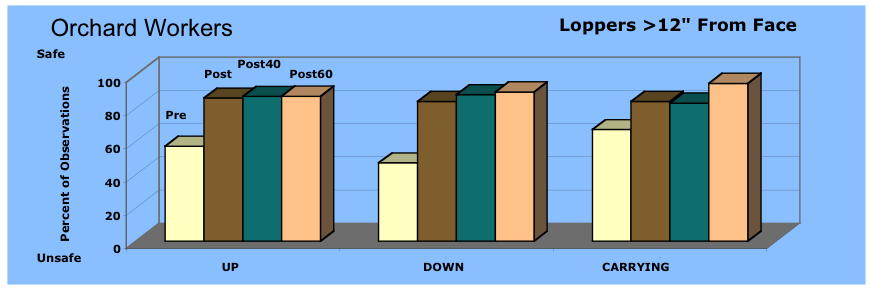
Shown below is increased safety in orchard workers who began carrying loppers more than 12″ from their faces after cTRAIN training taught ladder safety that included lopper safety. The improvement continued from post-training to 40 days and 60 days after training. These data are from a published study.
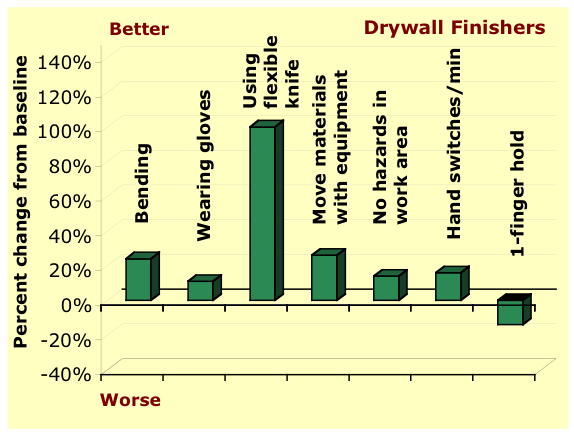
Shown below are results from an unpublished study of drywall finishers given training in work practices to reduce the risk of ergonomic injuries. The percentages shown are improvements over the baseline period before the training.